Data-Viz

Data Visualization Before Machine Learning
Do you ever ask yourself why your machine learning model isn’t used?
👉 Read More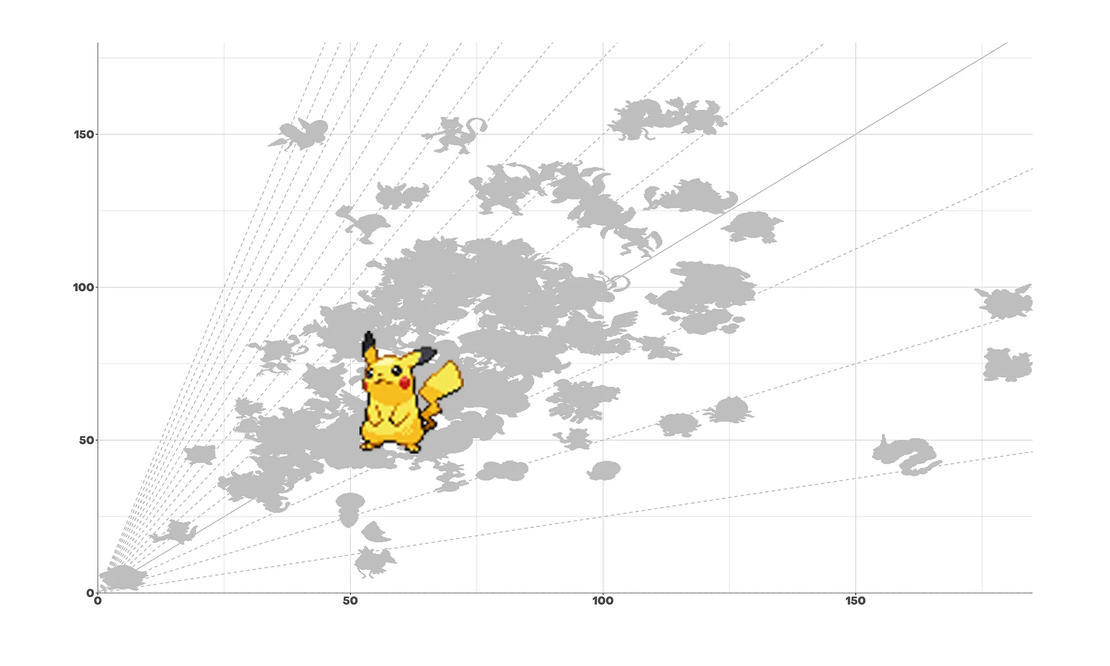
Gotta Grid’em All!
When building charts data visualizers often focus on colors, shapes, and element aesthetics.
👉 Read More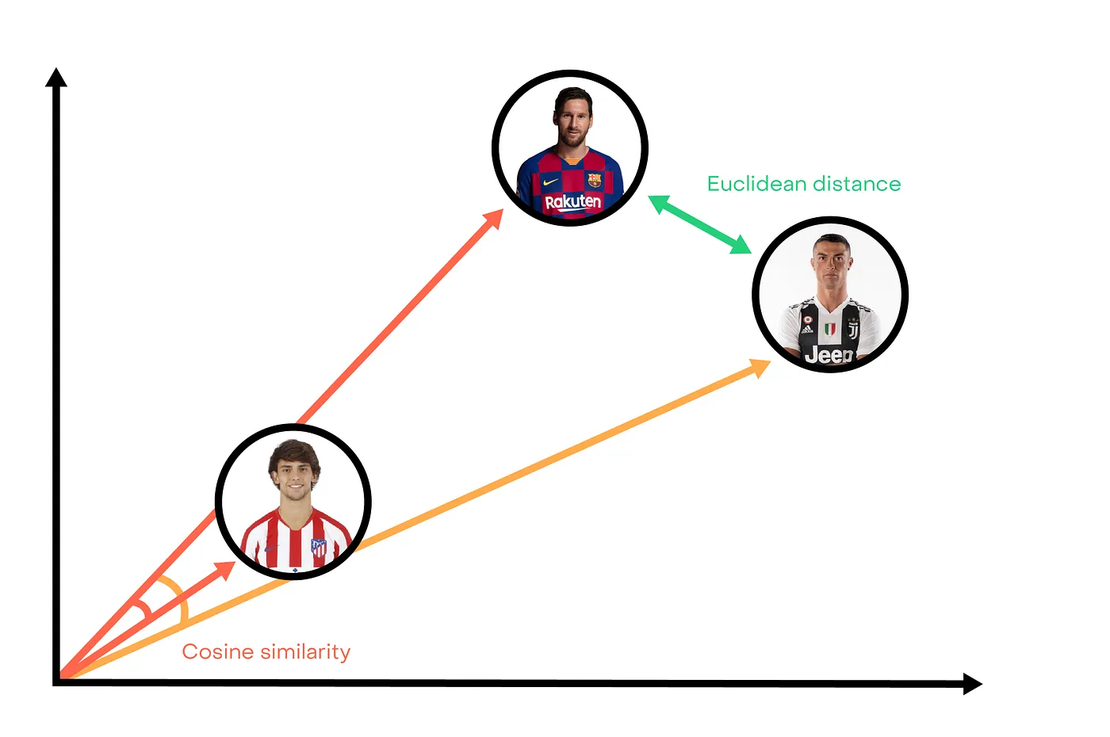
Player similarities & interpolation
Analyzing video, finding players from similar teams, traveling all over the world to scouts player: scooting activity can be long and fastidious.
👉 Read More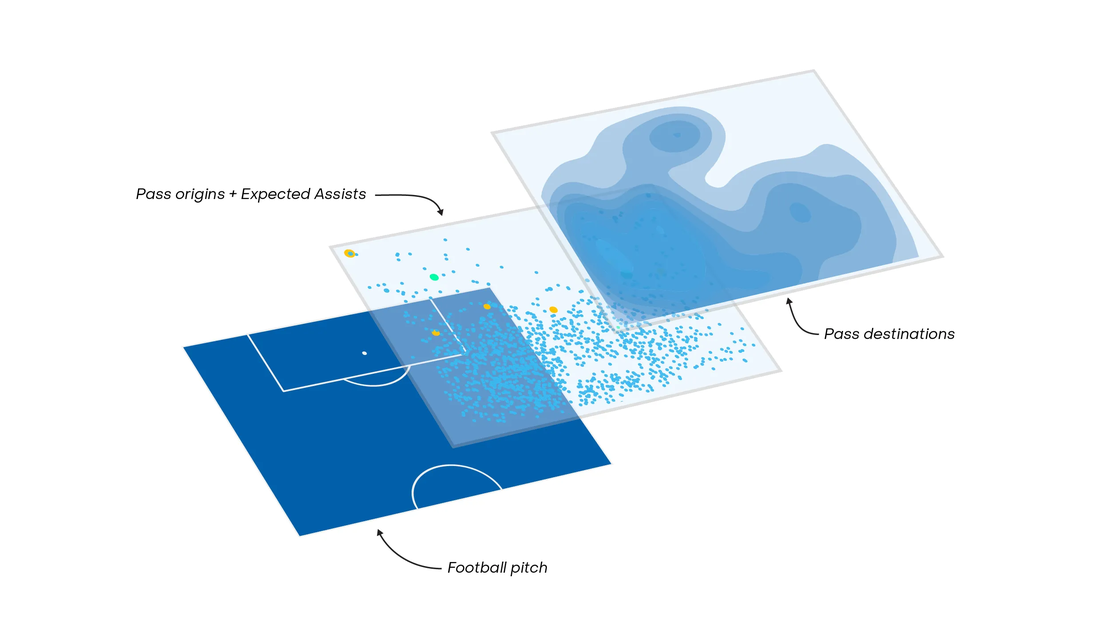
Beyond the Goal: Visualizing Expected Assists in Soccer
Basketball games have score lines in the triple digits. An NFL game in 2019 might produce a combined double-digit touchdowns.
👉 Read More
PassSonar: Visualizing Player Interactions in Soccer Analytics
Democratized thanks to Michael Lewis’ Moneyball (both the book and then the movie adaptation), baseball and basketball have already gone quite far in the realm of sports analytics.
👉 Read More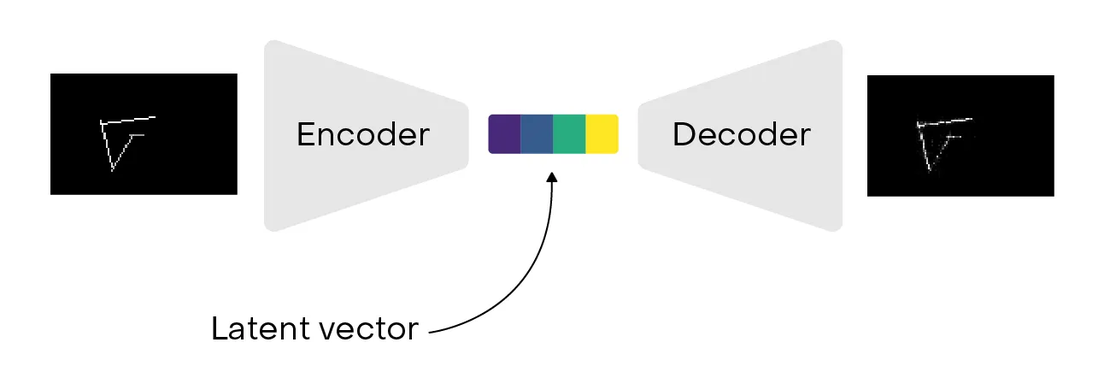
After raw stats: exploring possession styles with data embeddings.
The most basic way to identify a team style of play is to look at possession percentages, pass success rates, tackle rates, the average number of faults per game, etc….
👉 Read More