How to Make Great Schemas
- Communication , Design
- June 22, 2022
Explaining data assets is hard. There are a lot of tools, technical details, and jargon.
All the engineering and scientific systems underneath, though, often respect some kind of architecture—some kind of design.
That’s why we create schemas.
To explain machine learning models. To share software architectures. To document our pipelines.
Creating a schema is an important marker for the adoption of a system. You will use it in documentation, in decks, or to support the development of further ideas.
Still, it’s not that easy to summarize large systems into one graphic asset. Creating well-crafted schemas with good aesthetics is definitely a skill.
Let’s dive into some tips to design useful and pretty schemas!
Take a pen and paper
Before diving into software, colors, or shapes, it’s good to step away.
Take a pen and a piece of paper first.
You don’t need to focus on something specific. The first step is to put your mind’s map on paper.
If something is looking weird don’t erase it. Start a new draft on another sheet.
Keep all your drafts. It would be good materials to document your process afterward.
When you think you have a good plan, start to organize the pieces together. Make a clean draft, with all your elements structured.
Do you have all the items required to outline your system?
Do you need to split up your schema into many parts?

Focus on key items
The human mind is definitely more focused when looking at images.
That’s why we make schemas, isn’t it?
To enhance our schemas we should use proper graphic assets.
Sometimes our system depends on a subsystem: a database, a tool, or a complex element we want to keep abstracted. It’s useful to use a logo or a simple image to describe those subsystems.
To make a great schema we should use logos with good resolution and transparent background.
It will make your charts slick and more understandable.
Take your time to choose that image. Don’t use poor all-purpose logos…
It’s also a good idea to use different element sizes according to their importance. If subsystem details are important, create another schema. Don’t overload things. Your audience has limited attention.
Think about the “scale” you want to show. Is it a global schema, summarizing a big system? Or is it something that needs grain details? To support technical documentation?

Work on details
Great schemas are detailed ones.
Here are some details you can add to the different elements of your schema :
👉 Context Box
Adding light boxes can be a good first step to enhance a schema. Using dotted lines to group elements together can be a good idea too. It brings context.
You might prefer to use light greys or light colors as the goal here is just to help element distinction.

👉 Padding
Add space between boxes and arrows! Your schema will be easier to read.

👉 Rounded Corners (Optional)
Depending on the design you want, you should prefer to round the corners of your elements a bit.
This is maybe just a trend nowadays, but the big picture is often softened thanks to this little trick.

👉 Colors
Take your time with colors.
Too many colors and your schema is a failure.
Not enough it won’t be looked at all…
It’s often good to keep two or three colors at maximum. You can emphasize some parts with a well-chosen color. Keeping second-order elements in black or light grey.
🖇️ Here is a great guide for color in infographics .
👉 Contextual Annotations
Sometimes you might want to add some annotation to ease reader understanding. Adding just a little arrow and some text often does the trick.

👉 Alignment
This is basic.
Be sure that all your elements are aligned with each other. With the center of your plan.
Keep some white space margins all around your schema.
👉 Background
It might depend on the final support, but you will prefer to use white background or a transparent one.
Do not use background images.
👉 Export Format
There are different exportation formats. Here are some basic considerations:
- JPEG: if you don’t need transparent background and low file size.
- PNG: if you need a transparent background.
- SVG: if you want to be able to edit and resize your schema afterward — without loss.
👉 Fonts
Keep to one or two fonts maximum. However, feel free to use different sizes to bring scale to your schema. Do not hesitate to bold your important texts too.
🖇️ I save my favorite fonts on GitHub .
👉 Captions
Always add captions to your schema, either to refer to a source or to describe the overall system. It helps the reader to understand the context.
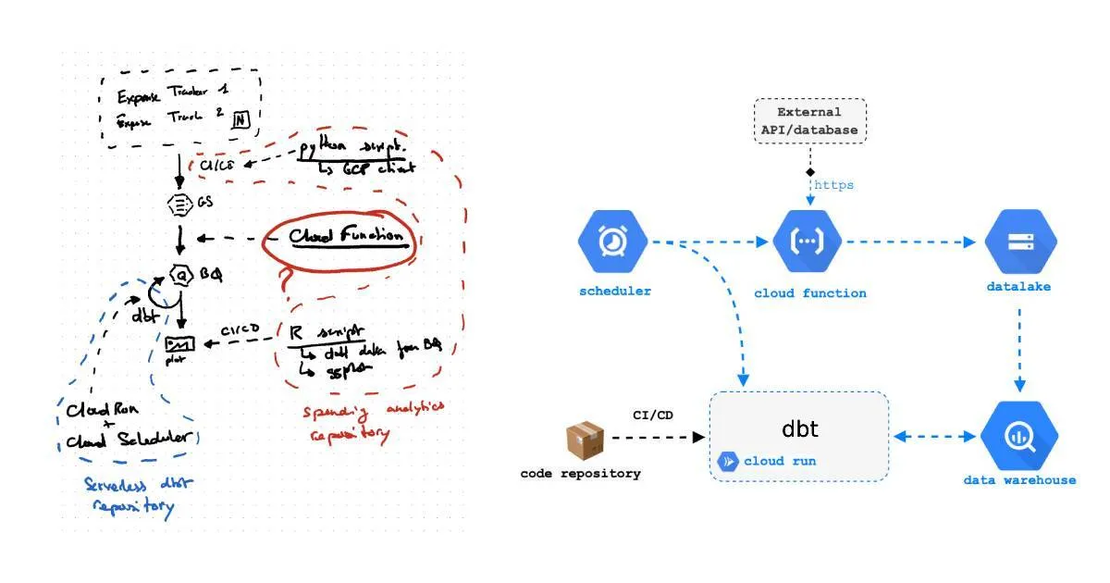
Tooling
Generally, a pen and piece of paper is the first tool you would use. They are the cheapest and most simple tools to start building your schema.
I personally use a Remarkable Tablet . It’s e-ink and comes with great features like cloud-syncing and layering. I can work everywhere and make different draft versions more easily.

When you have a first draft, you can go to the software world. There are many tools to create schemas. Here are some of the best ones :
👉 draw.io : Probably my favorite one. You can edit your schema easily, export in different formats, and sync to GitHub. There are a lot of shapes and features to arrange your elements together.

👉 tldraw.com : A bit simpler than draw.io but you can make beautiful schemas in a few clicks.
It has great features to create slick schemas with different styles.

👉 Figma : This tool is used more for designing user interfaces, but it has great features to create schemas.
A big plus: you can add interactivity and movements (making GIFs ?).
👉 Adobe Photoshop/Illustrator : using a proper graphic tool can be a good choice if you want full customization. You can do whatever you want. Time is the only limit.
I hope these tips help you get insights into how to make well-crafted schemas.
Those are simple tricks, but that’s what makes a difference when looking at great schema:
- Take a pen and a sheet of paper first!
- Think about your audience and about the context of your schema.
- Design and create the schema with some software following some simple guidelines that make your schema slick and understandable.
Don’t hesitate to reach me if you have any questions or just to chat about it 👋.