Gotta Grid’em All!
- Analytics , Data viz
- February 17, 2021
When building charts data visualizers often focus on colors, shapes, and element aesthetics. We rarely think much about the background, especially the gridlines where all our data lives.
Slightly changing the plot background can bring more context and improve the comprehensibility of your graphics.
A tiny change can add context
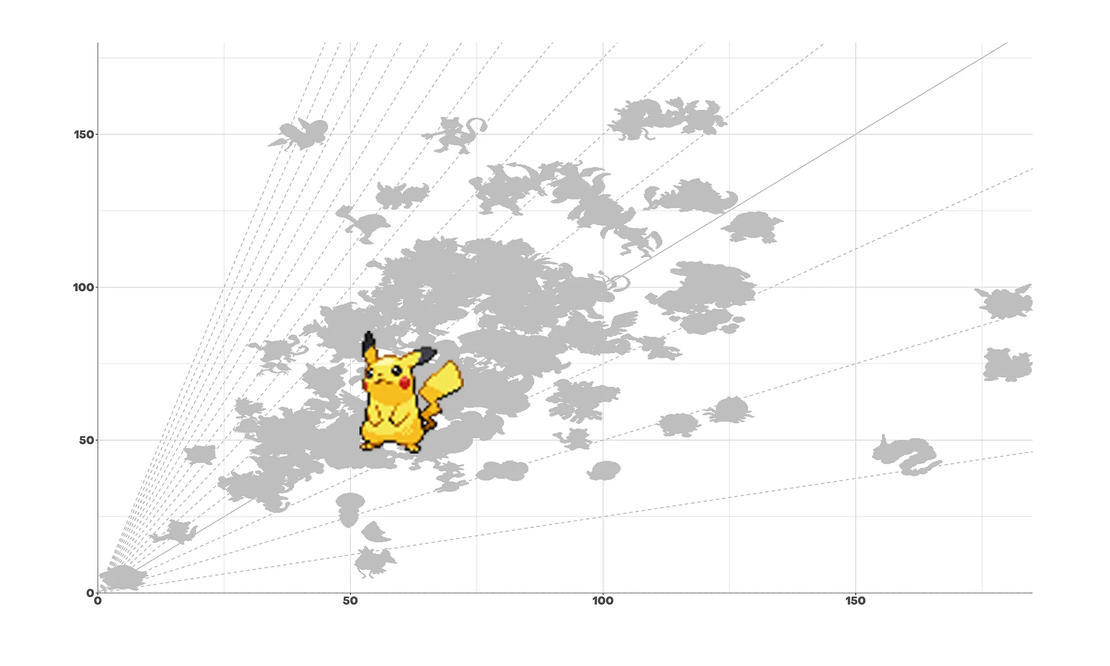
To illustrate this point, I visualized a Pokemon dataset containing information about each creature, including attack and defense statistics.

This classic grid doesn’t provide much information. You can differentiate data points from each other, but that’s all it offers.
Now consider the same plot with added gridlines arranged to highlight the sum of attack and defense statistics.

It was already quite easy to see that Pokemon on the top right are the strongest. Adding these dashed parallel lines on the second chart creates groups of characters within different levels of aggregation.
For instance, I added up attack and defense statistics to quickly differentiate overall Pokemon power. Pokemon aficionados often see Mewtwo as one of the strongest creatures, but not Cloyster , though it has better attack/defense mix overall.
Furthermore, you can play with the line distribution. In the example, lines are percentiles of attack and defense sum. You could choose regular intervals or another “clustering” metric, too. In other words, gridlines allow you to refine outlier analysis and help readers draw useful comparisons.
Highlight ratio for better differentiation
Another option is to consider the axis ratio.

As long as the y/x ratio is meaningful, this kind of grid can be informative. For example, see how adding diagonal lines to this plot highlights that Mewtwo, Flareon, or Hitmonlee (circled above) have almost the same attack/defense rate.
It’s also interesting to identify Pokemons more powerful in attack than in defense (or the opposite). With the line ratio equals to one, it’s easy to distinguish them.
Evolutions are a key element in Pokemon games. Starters are cute, but you have to evolve into more badass creatures to survive and progress throughout the story. It always been difficult to choose among the three starter families (fire, water, and grass). With these ratio levels you can better appreciate their differences.
See how these families vary in their attack/defense ratio for each member evolution. The last evolution of the grass family has a lower ratio than its basic form, while the water family always improves its ratio through each evolution.

Draw attention with curves and circles
Instead of straight lines, you could use complex curves, depending on what you wanted to highlight.
For instance, it’s sometimes interesting to compute the product between two metrics — especially with a ratio and quantitative value. The plot below shows the relation of attack/defense ratio and Pokemon “health” (hit points).

The curves here are the products of the x-axis and y-axis on different levels. This kind of hyperbolic curve is computed thanks to the y = c/x formula. You can perform a little math trick and return to the product form: x . y = c, where c is a constant. You can draw curves with different values of c.
Without plotting the data points along these curves, you would not be able to differentiate them from each other.
Thought not particularly illustrative with this dataset, you could also draw circles to show distances between data points. This maybe pushing the concept too far, but it can be an interesting technique to demonstrate distance between your data points and your focus.

Data visualization is a practice that sits at the intersection of good design and engineering principles. Sometimes examining the overlooked can improve your visualization. Adding more context is a key component to making your graphics easier to understand. It is even more important when your data represent complex metrics or when you are building custom chart designs.