Player similarities & interpolation
- Data viz , Football
- December 22, 2019
Analyzing video, finding players from similar teams, traveling all over the world to scouts player: scooting activity can be long and fastidious. Moreover, there are now more than one hundred professional leagues and so professionals players out there.
While scooting departments have many experts all over the world, the amount of games, players and statistics to follow on are sometimes too many to only relies on human abilities.
This is where soccer analytics comes in place. We will see in this piece that with some data and basic computer science, the scooting process can be enhanced with more speed, efficiency, and precision.
Characterizing players
The first question we have to answer is how to characterize players? While scooting departments have experts who rely on their feelings and experience of football, it’s difficult to gather this expertise with only data.
There are many good metrics developed in the football analytics community to capture complex patterns in player characteristics. Here, we will concentrate our exploration with EA Sports FIFA 20 video game player ratings.
These ratings are computed and refined by a whole team of scoots and experts in the domain. It is known that even sports data companies are using stats from video games to help real clubs recruit players. Although it can be a bit naive, this approach can be a good starting point to define real player attributes.
This database contains for every player more than thirty attributes: from attacking to defending or even mental ones.
As you would expect, we can see these attributes as characteristic vectors for every player. Maths begin.

Once again, this is quite simplistic. For those being curious about more complex models and metrics to characterize players, here are some resources worth looking:
- Using Deep Learning to Understand Patterns of Player Movement in the NBA by Akhil Nistala and John Guttag.
- OptaPro Analytics Forum 2019 — Player2vec: A sequence-first approach to player and team styles by Ben Tovarney.
Computing similarities
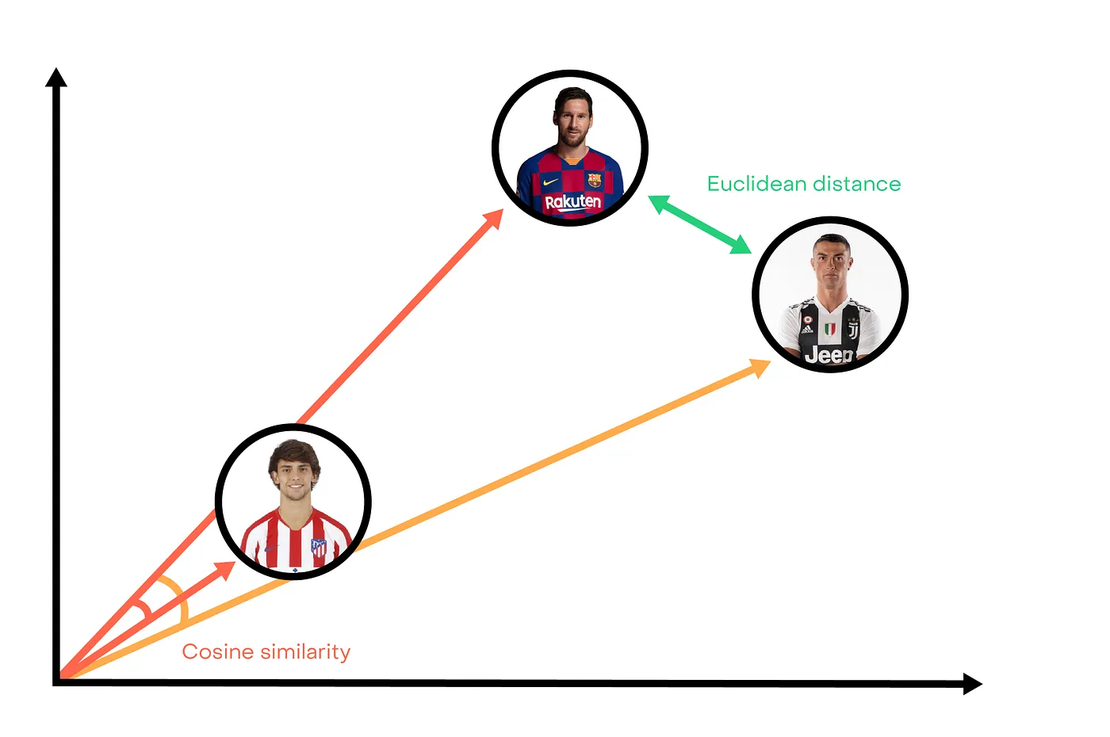
Now we have vectors to characterize players, so we are able to compute distances. The most common distance is the Euclidean one which is defined by:

Euclidean distance is like using a ruler to measure the distance. However, choosing this distance is probably not the best option. For example, Ronaldo is close to Messi because they have high ratings in shoots, speed or dribbles. But a young player like Joao Felix who has same profile to Messi will be further away because his attributes are weaker, but in the same proportion.

This is where cosine similarity comes. This is a measure of similarity between two vectors that looks at the angle between them.
Given two vectors of attributes x and y, the cosine similarity cos(θ), is represented using a dot product and magnitude as:

In our example, the angle between Messi and Joao Felix is smaller than the angle between Messi and Ronaldo. Even though they were further away.

Cosine similarity allows us to better capture “style” rather than pure “statistics” attributes. Let’s see some examples of similarities computed to better understand it:
James Maddison — Leicester City

James Maddison is one of the best young midfielders of the Premier League and a key player for Leicester squad this 2019–2020 season. Here we compute cosine similarities to get the five most similar players.
Results can seem a bit weird, but we have to remember they are players who have “the same style of play” of Maddison. Thus, they won’t have similar performances than the English player, but we can believe they have same skills and abilities on the pitch. Note that Martin Ødegaard, one of the most anticipated young, is the tenth most resembling player to James Maddison.
Valentin Rongier — Olympique Marseille

This example is very interesting. Firstly, it is a good point to see Alcantara brothers (Thiago and Rafinha) close to each other. Though the Bayern Munich player perform better than his brother, they have logically the same style of play.
If you ever see Valentin Rongier play, you can feel how is style of play is close to Thiago. While Vladimir Darida and Lukas Rupp are more surprising names, there are Pablo Fornals, Aleix Garcia (a talent from Manchester City), Arthur or even Modric in the list of most similar players to Valentin Rongier. Not that much surprising.
Going further with vector interpolation
As we saw, similarities are already interesting. For example, a club like Manchester United want to replace Paul Pogba could try to find the most similar players to the French midfielder.
But we can go a little further thanks to the nature of vector representation.
What if Manchester United staff wants to find a player like Paul Pogba with a part of Mesut Ozil skills?
This is where vector interpolation comes in. By taking Paul Pogba vector representation mixed with Mesut Ozil one, we can create an interpolated vector and then looking for the closest one from our player database.

So in our example, the most similar player to both Paul Pogba and Mesut Ozil is Roberto Firmino. It is quite logical when you know the Brazilian striker is playing very low on the pitch. Like the French and the German, he is a very skilled player with a unique vision and sense of the game. Note that players that comes after Firmino in the list are Lionel Messi, Paulo Dybala, Philippe Coutinho or Kevin De Bruyne.
Here we equally mixed off Pogba and Ozil vectors. It is possible to vary the part of each player vector in the calculation of this interpolated vector. Instead of taking 50% of Pogba and Ozil vectors we could take 80% of Pogba and only 20% of Ozil to get a vector which will be more similar to Paul Pogba.
The general formula is quite straightforward, with alpha being our proportion parameter, x and y two-player vectors:

Another interesting use case: what if a club wants to replace one of his player by a better player. A bit like an “upgrade”. This club doesn’t have the budget to buy a starship player but really want to find a player with a similar profile.
Here is an example with Angelo Obgonna the central defender of West Ham and Sergio Ramos.
By computing many interpolated vectors with different values of alpha we will obtain different players looking more or less similar to Ogbonna.

The results are pretty interesting. Moving the proportion of vectors in the computation from Ogbonna to Ramos results in different “gradient” of players more or less similar to the two players.
Here is another example with Eric Lamela and Mohamed Salah.

These examples prove the power of this effortless computation: players uncovered could be a good targets to improve either West Ham or Tottenham squads in these examples. Taking advantage of this “gradient” of player, this method also offers many solutions according to the willingness of the club.
Limits and workarounds
As we noted earlier, doing this experiment with FIFA 20 player database can be too simplistic. Though these data are made by human experts, they can lack some traits or details on more stylistic attributes for each player. It sounds difficult to capture the style of play of Eden Hazard just by giving good ratings in speed, vista or vision items.
Beyond the problem of finding good representing vectors, this method is easy to set up. Distances are quite easy to implement in any modern “data” software and the interpolation computation is quite direct too. We could derive this idea on a full team and then comparing lineups for each game. We even can go further with entire games: taking all game events, what are the most similar games? Answering this question, we could compare games at a high scale and maybe try to detect the best options in specific moments…